What Real-Time Gambling Data Reveals About Sports: Introducing Gambletron 2000
Todd Schneider | March 12, 2014
What are the most exciting matchups in sports? What’s the most exciting sport? What if a computer could tell us which games are hot right now—like an NFL RedZone channel, not just for NFL football, but for basketball, soccer, hockey, and baseball?
Introducing Gambletron2000.com, a tool that uses live in-game gambling data to quantify excitement in sports, write automated game recaps, finally settle the debate about whether the first half of NBA games is even worth watching—and much, much more. It might even make you rich.
It’s 12:52am on January 2nd, 2007. Boise State has just shocked Oklahoma to win the Fiesta Bowl. Meanwhile, I’m staring at the game’s TradeSports page, watching the gambling odds fluctuate almost as wildly as the game itself. The last few minutes of the TradeSports graph looked like an EKG gone haywire: one minute Boise State had a 90% chance to win, then only moments later it was Oklahoma who had a 95% chance to win, until somehow Boise State miraculously pulled out the victory.
It occurred to me then that variance in gambling market odds is a good way to quantify how exciting a game is. Modern betting exchanges allow gamblers to bet throughout the course of a game. The odds, which can also be expressed as win probabilities, continually readjust as the game progresses. My claim is that the more the odds fluctuate during a game, the more exciting that game is.
For example, the 2014 BCS National Championship Game between Florida State and Auburn was universally regarded as a thrilling game, and sure enough, the real-time gambling odds fluctuated wildly right up until the end:

This graph shows the probability that Florida State will win on the y-axis, and the time on the x-axis. Since Florida State did win, the graph ends at 100% in the top right corner. Had Auburn won, the graph would have ended at 0% in the bottom right corner
Florida State entered the game as the strong favorite; gamblers thought they had a 78% chance of beating Auburn before the game started. However, Auburn seized the early momentum and built a quick 21-3 lead, at which point the gambling markets thought that Auburn had a 75% chance to close out the win. Florida State clawed its way back into the game, and then at the very end the teams exchanged touchdowns over the final minutes, creating the whipsaw effect you can see in the graph above.
Now compare that graph to an obviously boring game, Super Bowl XLVIII:
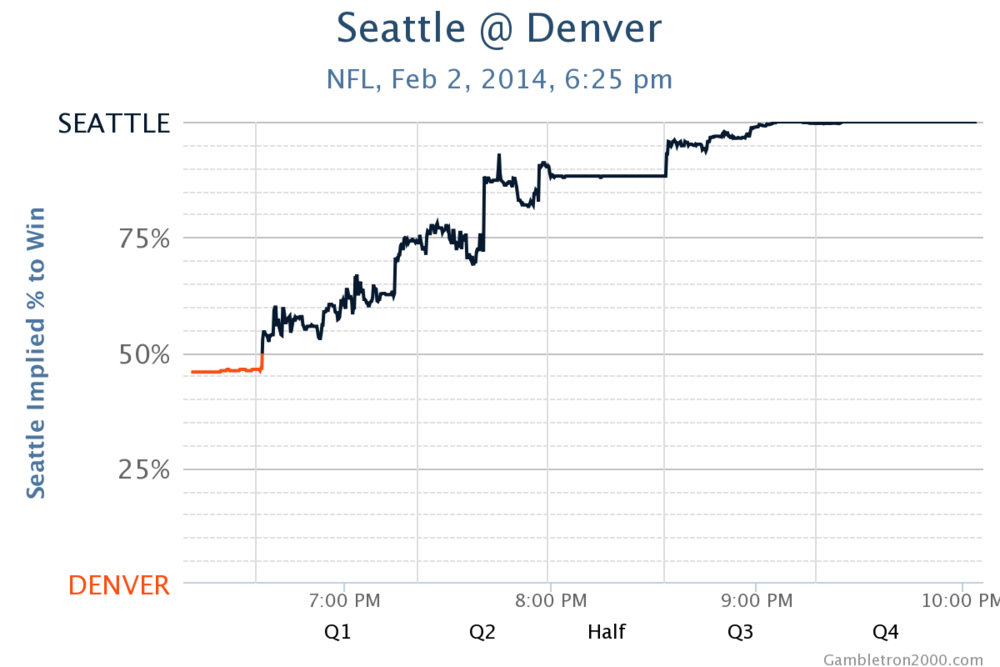
It seemed like an even matchup at first, but Seattle got off to a quick start, and Denver was completely unable to respond. The gambling odds moved steadily toward a Seattle victory. There was no comeback and no suspense, an all-around snooze fest.
Since October 2013, Gambletron 2000 has been collecting real-time betting market data across all major sports. Initially all I wanted was to rank-order games by excitement, but to my surprise I discovered that in-game gambling data allows us to answer other interesting questions. Among them:
- Which teams have made the most improbable comebacks? The biggest chokes?
- Which sport is objectively the most exciting?
- Is the first half on an NBA regular season game really as meaningless as it seems?
- Could I make money using any of this data?
Gambletron can even be used to write automated recaps of games, and provide us with a live dashboard of the most exciting games on right now—like the NFL’s RedZone channel, but across all sports.
How Gambletron 2000 works, in a nutshell
For the uninitiated, betting exchanges allow customers to buy and sell contracts whose values depend on the outcome of sporting events and other competitions (e.g. political elections). A contract is typically worth some fixed amount of money if your team wins, and $0 if your team loses. For example, you might buy a contract on Boise State for $4 which would pay you $10 if Boise State wins, for a profit of $6. If Boise State loses then you lose your $4.
One of the many neat things about betting exchanges compared to traditional bookmakers is that you can continue to bet throughout the game. If the price of a Boise State contract was $4 to start the game, but then Boise State scored two touchdowns to take a 14-0 lead, you might be able to sell your contract to someone else for $7, pocketing the $3 difference for yourself. As the game unfolds, market participants continually adjust the prices they are willing to pay for either team, and Gambletron 2000 observes the prices of those contracts and converts them to market-implied probabilities of each team winning.
Gambletron 2000 started collecting data in October 2013 across several major sports: NFL, NBA, MLB, NHL, soccer, NCAA football and basketball, and, most recently, Olympic hockey and curling. There are more than 2000 sporting events in the database. When a game starts, Gambletron 2000 monitors betting markets every 15 seconds and records probabilities for each team>. The end result for each game is a graph that looks like this:

This graph shows win probability for an NFL game featuring the Denver Broncos at the New England Patriots, from November 24, 2013. When the game started, the market assigned Denver a 51% chance of winning. Denver built a 24-0 lead throughout the first half, and at halftime the market implied that Denver had a 93% chance of winning. However, New England staged a furious second half comeback, and eventually won the game in overtime.
The essence of Gambletron is an algorithm that uses this data to create a measure of "hotness". I toyed with a few different hotness algorithms, but eventually settled on one that considers the variance of changes in the market-implied win probability (WP) over 2 minute intervals. Mathematically, for a game that starts at t = 0 and ends at t = T, the hotness calculation looks something like this:

In words, we take all of the 2 minute intervals, calculate the change in win probability over each interval, square it, sum them all up, and then divide the total by the length of the game. There's also a constant K, which was chosen so that a hotness value of 1,000 roughly corresponds to the threshold for a "good" game.
With that, let's dive in and see what kind of stories the Gambletron 2000 can tell us.
What are the most exciting games of all time since October 2013?
Since the Gambletron 2000 was turned on in October of 2013, the single hottest game across all sports came from the NFL regular season, when the Baltimore Ravens defeated the Minnesota Vikings on December 8, 2013:

The first half of the game was remarkably uneventful; the snowy weather along the east coast that day made it difficult for either team to do much. But the end of the game was truly rare: the teams exchanged 5 touchdowns over the final 125 seconds of game time, producing the wild seesaw graph above, punctuated by Baltimore scoring the winning touchdown with 4 seconds remaining on the clock.
Featured games by sport:
NFL
| Minnesota @ Baltimore | Dec 8, 2013 | 5,654 |
| Dallas @ Detroit | Oct 27, 2013 | 3,734 |
| Chicago @ Minnesota | Dec 1, 2013 | 3,688 |
NBA
| LA Clippers @ Denver | Feb 3, 2014 | 5,178 |
| Chicago @ Milwaukee | Dec 13, 2013 | 5,007 |
| Golden State @ Atlanta | Jan 3, 2014 | 4,536 |
NCAA Football
| Alabama @ Auburn | Nov 30, 2013 | 2,199 |
| Duke vs. Texas A&M | Dec 31, 2013 | 1,924 |
| Georgia @ Auburn | Nov 16, 2013 | 1,862 |
NCAA Basketball
| Syracuse @ Pittsburgh | Feb 12, 2014 | 4,529 |
| Arizona @ Arizona State | Feb 14, 2014 | 2,624 |
| Duke @ Syracuse | Feb 1, 2014 | 2,288 |
Hockey
| USA vs. Russia | Feb 15, 2014 | 2,043 |
| Ottawa @ Columbus | Jan 28, 2014 | 1,716 |
| Slovakia vs. Slovenia | Feb 15, 2014 | 1,708 |
MLB
| Boston @ St. Louis | Oct 26, 2013 | 1,246 |
Which sport is the most exciting?
Despite the NFL holding the honor for single most exciting game in the Gambletron 2000 database to date, it’s actually the NBA that has the most hot games. The NBA holds 9 of the top 10 hottest games in the database, and 40 of the top 50. To be fair, the NBA has more games in the database than any other league, so a better way of comparing sports might be to consider average hotness. When we average results across sports, whether by mean or median, the NBA beats the NFL by a small margin, with a mean hotness score of 908 compared to the NFL’s 843. NHL games have an average hotness of 680, although the different structure of hockey betting, where ties are commonplace, makes the NHL difficult to compare.
College football and basketball fare significantly worse than their professional counterparts when comparing average hotness rankings, with mean hotness scores of 531 and 712, respectively. This isn’t particularly surprising: top college teams in both basketball and football often pad their schedules with so-called “cupcake” games, and inevitably even the strongest conferences have teams that can’t compete with the top dogs. Both of these factors lead to a large number of lopsided college games with little excitement.
However, despite the low average hotness for college sports, there are still many individual college games with high hotness rankings. Prime examples include Syracuse’s buzzer-beating win over Pittsburgh in basketball, and Florida State’s comeback victory over Auburn in the football national championship game. Undoubtedly Gambletron 2000 will continue to identify excellent college basketball games this March during the NCAA basketball tournament.
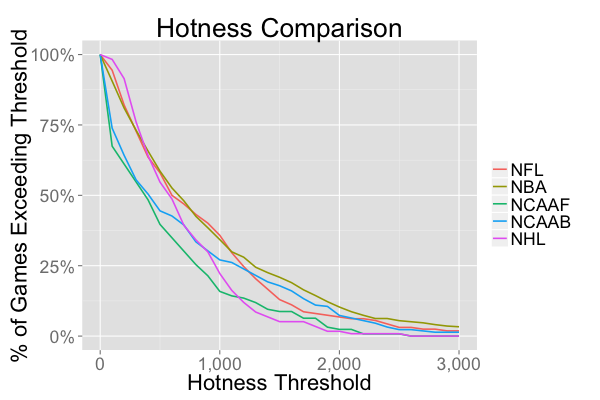
But averages aren’t always the best way to compare. Since a game with a hotness score of 1,000 or greater is considered a “good” game, we can calculate the percentage of each sport’s games that meet this criterion. The NFL and NBA have similar rates, with 35% of games meeting the “good” threshold, while college sports come in at somewhat lower rates.
So NBA games are the most exciting, eh? What about the stereotype that the first half of an NBA game is meaningless?
Yes, NBA games do have the highest average hotness rating of any league in the Gambletron 2000 database. However, there might also be something to the stereotype. If we calculate hotness for the first half only, the NBA actually has the lowest average hotness of any league. Remember that hotness is a proxy for how much win probability varies, so for the NBA to have the lowest average first half hotness means that win probability does not vary much during the first half of NBA games. Perhaps all those Lakers fans who show up at halftime are on to something. On the other hand, all the leagues have significantly lower average hotness in the first half compared to the second half, so maybe it’s not just the NBA that has a boring first half problem.

The greatest comebacks and chokes
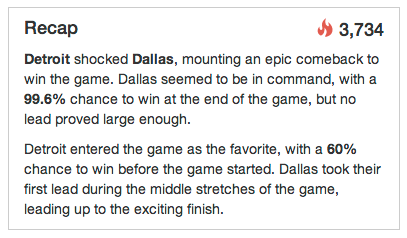
Which team had the most unlikely comeback to win a game? A simple way to measure that is to take all winning teams, and find the one that had the lowest win probability at some point during the game. By this measure, the biggest comeback came from the NFL, when the Detroit Lions beat the Dallas Cowboys on October 27, 2013:
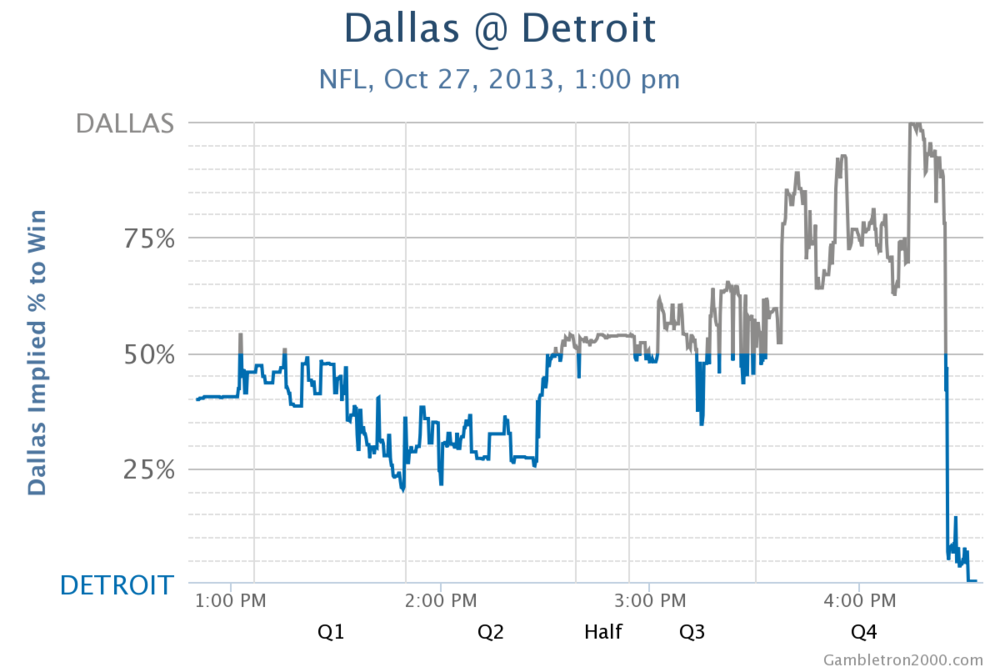
With only 1:24 to go, Dallas led by 3 points and had a first down in Detroit territory. The market was trading as though Dallas had a 99.6% chance of winning the game, and yet somehow Detroit held Dallas to a field goal (with the aid of a clock-stopping holding penalty against Dallas), then marched down the field to score the game-winning touchdown on a surprise quarterback sneak.
Of course one team’s comeback can easily be another team’s choke, so what if we wanted to quantify the biggest choke jobs of the year? We could say that a choke is simply the inverse of a comeback, in which case the Dallas Cowboys would be considered the biggest chokers, but maybe we should define “choke” differently. In the case of Dallas and Detroit, Detroit was the favorite coming into the game, so maybe it’s unfair to say that Dallas choked, when Detroit was considered the better team.
We could define a game’s “choke factor” as the average win probability for the losing team over the course of the game. If the losing team led for most of the game and only lost at the end, that’s consistent with a choke. It sounds a bit confusing, but a graph makes it easier to understand. By this definition, the NBA’s Miami Heat hold the record for biggest choke in the Gambletron 2000 database, when they lost to the Boston Celtics on November 9, 2013:

The Celtics won by a score of 111-110 on a 3-pointer buzzer beater by Jeff Green, but until then the Heat had been strong favorites to win at every single point of the game. In fact, the Heat had a higher win probability than the Celtics did for 99% of the game. The Heat averaged an 86.5% win probability for the entire game, and yet they lost! The Heat expected to beat the Celtics, were beating them for nearly the entire game, and yet found a way to lose—a textbook choke.
Do even matchups generally produce more exciting games?
Not much surprise here: yes! The data shows that the games where the favored team begins with a smaller expected advantage, on average, tend to produce more exciting games:

NFL RedZone for all sports?
Gambletron 2000 keeps a running scoreboard of all live games, ranked by hotness over the past 15 minutes. The hotness algorithm is exactly the same, except instead of summing over the entire duration of the game (which hasn’t finished yet), it sums over the most recent 15 minutes of action.
Of course sporting events tend to occur on weekends and evenings, so if you check midday during the week, it’s unlikely there will be any live events, but next time there are a bunch of games on, check it out. Here’s what the live dashboard looked like on December 29, 2013, at 6:45 PM Eastern:

The most exciting game on at the time was Golden State at Cleveland, and the biggest dud was St. Louis at Seattle, which was effectively over. You can think of the live dashboard as a complement to the NFL RedZone Channel, except across all sports. If Seattle is pummelling St. Louis 28-0 in the 4th quarter, do you really care that St. Louis finally got into the red zone during garbage time? Similarly, in the close KC-SD game, you definitely want to know about a turnover or other large momentum swinging play, even if it didn’t occur in the red zone. The live dashboard gives you a tool to do just that—check it out next time you’re trying to follow several games at once!
Writing automated game recaps
If you didn’t watch a single second of a game, and all you got to look at was data from the Gambletron 2000, do you think you would be able to write a reasonable recap of the game? You might not be able to reference any specific plays, but the change in the market-implied win probabilities over time gives you a pretty good idea of the flow of the game.
Gambletron 2000 attempts to write a simple recap of each game based on several indicators from the data. First it categorizes a game into a high-level type: was it a wire-to-wire domination? A big comeback? An upset? A close-fought battle? The type of game determines the structure of the recap, which then gets decorated with game-specific details, e.g. how big was the comeback? How many probabilistic lead changes were there? When did the winning team take the lead for good?
For example, Gambletron 2000 summarizes the aforementioned Detroit/Dallas comeback game:
Gainfully employed sports writers probably shouldn’t worry about their day jobs just yet, but remember these Gambletron 2000 recaps are “written” with minimal human intervention, and they often do a pretty good job of describing the overarching themes of the game. With more effort and increased data availability, who knows what the future holds for computer generated game recaps. Maybe the sports journalists will soon be ceding power to our new computer journalist overlords...
Just how accurate are the markets at predicting winners?
Markets aren’t always correct, any individual game can defy expectations, but on the whole, the markets do a pretty good job at predicting outcomes of sporting events. When we bucket teams by pre-game win probability, then calculate the percentage of teams in each bucket that actually won, we get the following graph:

Maybe there’s a slight tendency for teams in the 10-20% range to win at a slightly higher rate than expected (and consequently teams in the 80-90% range to lose more than expected), but the difference is pretty small, and given the number of observations and parameters, it would not be surprising if this deviation occurred completely randomly.
We can make a similar graph using halftime win probabilities:
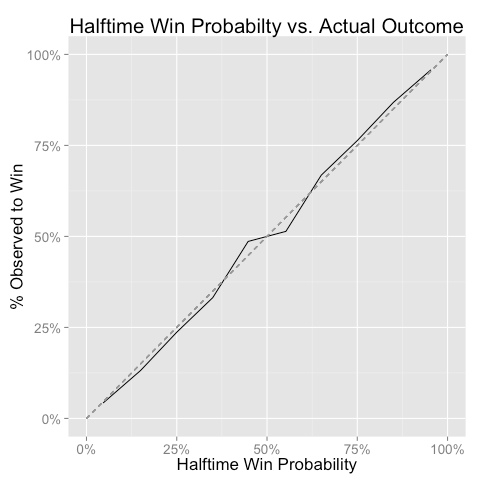
Again the market looks pretty accurate, though the data points around 50% look a tiny bit off. Another back-of-the-envelope calculation though suggests that the results are not statistically significant; it would not be surprising if the deviations occurred due to random chance.
Could someone make money using the data from Gambletron 2000?
That’s a great question, and the answer is a resounding “maybe, but it won’t be easy!” Gambling markets can involve significant transaction costs, so even if you found, for example, that teams who have a market-implied 20% win probability actually win 21% of the time, that small difference might not be enough to overcome whatever fees and expenses you incur while trading.
At any given moment, there will always be a bid-offer spread, which means that if you want to bet on a team, you’ll have to do so at a higher price (win probability) than if you wanted to bet against that team. Gambletron 2000 uses the midpoint of the bid and offer as the win probability, which is reasonable as long as the bid-offer spread is fairly narrow. Games where the bid-offer is too wide are discarded from the final dataset. The average bid-offer spreads vary by league:
How do we interpret these numbers? The NFL mean bid-offer of 3.4% means that if the win probability for a team at some moment is 40%, you could typically either buy that team at 41.7%, or sell that team at 38.3%. The difference (41.7 - 38.3 = 3.4) is the bid-offer.
European soccer has the narrowest bid-offer spreads, which makes sense because the betting exchanges are mostly based in Europe, where soccer is the most popular sport, and more gambling action leads to narrower spreads. Among North American sports, the NFL and NBA have the narrowest spreads, while college sports and the NHL tend to have wider spreads. All things held constant, a narrower bid-offer is advantageous for gamblers because it lowers transaction costs, but “all things held constant” is a tremendously untrue qualifier.
Bid-offer spreads generally widen when the market perceives a high degree of uncertainty, or there are simply fewer market participants. If you’re betting in a market that has a wide bid-offer, that probably means that the other market participants are not very confident about their positions, so if you feel good about your convictions (maybe you’re particularly knowledgeable about some obscure college football team), the wide bid-offer might not be much of a deterrent.
The bid-offer tends to narrow in absolute terms as the outcome of the game becomes more certain, i.e. win probability approaches 0 or 100%:

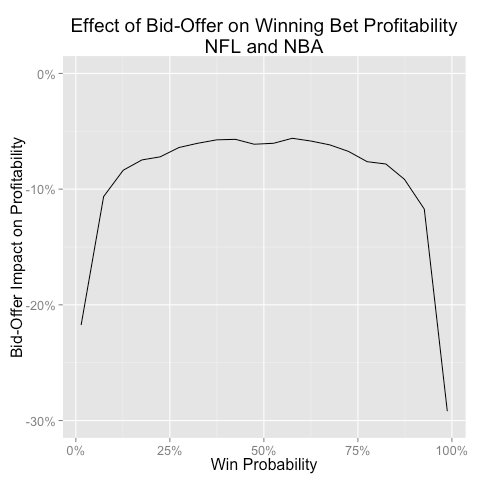
However, what gamblers really care about is profitability, and in that case, the bid-offer’s impact is most largely felt at extreme probabilities. Consider the aforementioned Detroit over Dallas comeback game, where Detroit had a 0.4% win probability at the end of the game. If you had bet $1 on Detroit at 0.4%, you would have collected $250 when Detroit won. However, because of the bid-offer spread, it’s likely you would not have been able to bet on Detroit at 0.4%. Instead, you might have gotten a price closer to 0.8%. If you bet on Detroit at 0.8%, you only would have collected $125 when Detroit won: the seemingly small bid-offer just cut your profitability in half!
For NFL and NBA games, which have among the narrowest bid-offers, gamblers can expect to surrender about 6% of their profitability on winning bets that are made on teams between about 25% and 75% win probability. As gamblers bet on teams with more extreme probabilities, the bid-offer consumes an even more substantial chunk of potential profits:
The bid-offer also tends to widen when there are large swings in win probability. This makes sense intuitively: when a surprising event happens, it’s natural for gamblers to step back and assess the event’s impact on how they should continue to bet. The gamblers might want to wait until things settle before wading back into the market, and until they reenter the fray, the bid-offer remains wider. Here we see that NFL and NBA bid-offer spreads increase when win probability fluctuates more over the previous 30 seconds:

Of course win probability usually does not move a lot over a 30 second window: the median difference is only 0.5%, and a 10% difference corresponds to the 98th percentile. However, on the occasions that the win probability does move a lot, you can expect that the bid-offer will widen until the market participants have time to assess what just happened.
Ugh, transaction costs are annoying! But I could still make money if I developed a model that was better than everyone else’s, right?
Even putting transaction costs aside, remember that gambling market participants have strong incentive to take into account all available information when placing their bets. That makes it difficult (but not impossible) to devise a model that can estimate win probabilities more accurately than the market.
Think of it another way: say you had a magical crystal ball that always told you the correct win probabilities for any game at any time. You’re watching the Super Bowl between the Seahawks and the Broncos, and the gambling markets say that the Broncos have a 54% chance of winning as the game starts. But your crystal ball tells you that the Broncos really only have a 30% chance of winning, and the heavens have decreed that the crystal ball is always right. Wouldn’t you then go into the market and aggressively sell the Broncos until the price drops to 30%? More importantly, isn’t this the plot of Back to the Future Part II?
In fact people have done a lot of great work in recent years devising models for win probabilities. AdvancedNFLStats.com publishes win probability graphs for NFL games based on its own proprietary model, inpredictable.com does something similar with NBA games, and of course the Sabermetric movement in baseball pretty much gave birth to the concept of statistical analysis in sports. It’s possible, even likely, that the participants in betting markets make use of such models in order to guide their in-game betting.
One nice thing about a model-based approach to calculating win probabilities is that you don’t need all of the operational infrastructure of a market. For example, the Advanced NFL Stats win probability model’s inputs are:
- Time remaining in the game
- Score differential
- Which team has the ball
- Field position
- Down and distance
Anyone with a TV or computer can easily observe all of those factors, plug them into a calculator, and out comes the model’s win probability. If the model’s probability differs from the current market win probability, and you believe in the model, then it would be an attractive time to make a wager.
A betting strategy based on following a win probability model will only succeed if the model can, at least at times, predict win probabilities more accurately than the market can. We’ve already seen that the markets tend to be pretty accurate on the whole, but there still might be conditions under which the markets could be exploited by a smarter model.
One reason that market-based win probabilities will tend to be more accurate than model-based probabilities is that the market-based probabilities are not beholden to the inputs of form of a model. Any model, no matter how sophisticated, will have difficulty capturing every possible explanatory factor without falling victim to overfit. How does the Advanced NFL Stats model account for a mid-game injury to a star player? What about the weather? The short answer is that it doesn’t. If you’re watching a Green Bay Packers game and Aaron Rodgers leaves the game with an injury, or even just develops a noticeable limp, wouldn’t that impact your expected probability of a Packers win?
The Advanced NFL Stats model is one of the best and most respected football models, and yet it doesn’t even take into account the fact that one team might be obviously better than the other! Look at the inputs again: score, time, possession, and field position. At the beginning of every game, the score is tied and nobody has possession, so as far as the model is concerned, each team has a 50% chance to win. Try explaining that to a hapless Buccaneers fan the next time Tampa Bay travels to Seattle. To its credit, Advanced NFL Stats has a beta version of the model that takes into account team strength, but that version is not yet official, and it still fails to account for injuries, weather, and other subtleties that the market-based probabilities are likely to capture.
Compare the Gambletron 2000 and Advanced NFL Stats win probability graphs for the Tampa Bay at Seattle game:


The Advanced NFL Stats model (bottom) started the game at 50/50, while, Gambletron started the game with Seattle at 92% to win. At halftime, when Tampa improbably led the game 21-7, Gambletron said the game was 50/50, while Advanced NFL Stats model projected TB had a 90% chance to win. Seattle eventually came back and won
We might call the Advanced NFL Stats approach to win probability a fundamental model: it’s based on real, underlying things that happen in football games. Instead of, or in addition to, developing a better fundamental model, you might also adopt a more technical approach. You could study market data to look for patterns that repeat, and then place bets when you see such patterns in the future. This kind of analysis is popular in the world of finance, where people often scour stock prices for signs of momentum, mean-reversion, or, somewhat paradoxically, both.
It’s a reasonable question to ask of gambling data too: if a team’s win probability has increased from 50% to 60% in the past 2 minutes, what is that team’s win probability likely to do in the next 2 minutes? A basic analysis of the Gambletron 2000 data suggests that win probabilities follow some degree of mean-reversion:

The graph shows that if a team’s win probability increased from 50% to 60% over the past 2 minutes that’s a +10% difference, and over the next 2 minutes on average the team’s win probability will drop by -0.5%, to 59.5%. That’s not a very large decline, especially since the standard deviation of 2 minute changes in win probability is about 5%. If you believe that 2 minute WP changes follow a normal distribution with mean = -0.5 and sd = 5, then there’s about a 54% chance that the team’s WP will decline in the 2 minute period following the 10% increase.
That might not be a big enough edge to make a profit, but it’s also a very simplistic analysis that could be improved upon: we might consider the absolute win probability in addition to change over the past 2 minutes, since win probabilities are bounded at 0 and 1, and maybe the patterns differ by sport or along other dimensions. It might also be worthwhile to augment fundamental data with market data for an even more in-depth analysis. At the very least, the data gives us an enticing glimpse that there might be a profitable strategy of betting against the team that just scored, or betting on the team that just suffered some bad event, and hoping for mean-reversion to work in our favor.
Ultimately, remember this: if someone developed a perfect model for win probabilities in the NFL or any other sport, that person would have strong incentive to use that model to place bets when the market diverged from the model. Those bets, as they became large enough, would eventually move the market prices until the market converged on the model expectations. The good news for gamblers, though, is that almost certainly nobody has developed a perfect win probability model for any other sport, and so there remains room for improvement. Massive fortunes have been made (and lost) by people who develop algorithms to trade stocks and other financial instruments, and so it wouldn’t be shocking if someone managed to do the same in the world of sports.